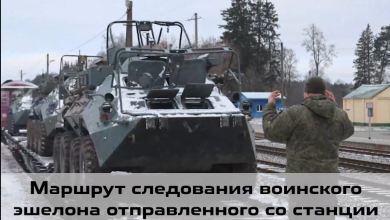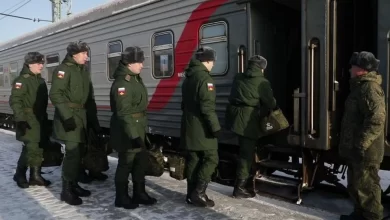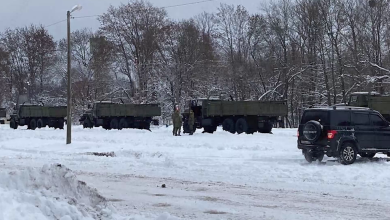
The delivery of ammunition from Russia to Belarus continues. We have identified a new shipment involving the company TRANSRAIL-BCh, this time of ammunition for automatic small arms. This may indicate the ongoing buildup of military potential in our country. The information below is a verified part of the covert arms deliveries to our country from Russian territory. According to available information, such shipments take place at least once a month.
On December 10, 2023, at Barnaul station (Russian Federation, Siberian Federal District, Altai Krai, Altai Region of the West Siberian Railway), three four-axle boxcars Nos. 28087310, 29029196, 29030798 were accepted for transportation.
The contents of two railcars, in accordance with the Harmonized Nomenclature of Goods (GNG), are designated as: “93063010 – cartridges for revolvers and pistols, as well as for automatic weapons”. The third railcar is used as a buffer railcar.
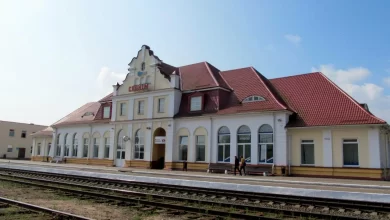
The destination of this shipment is Golynets station (Belarusian Railway, Mogilev Region).

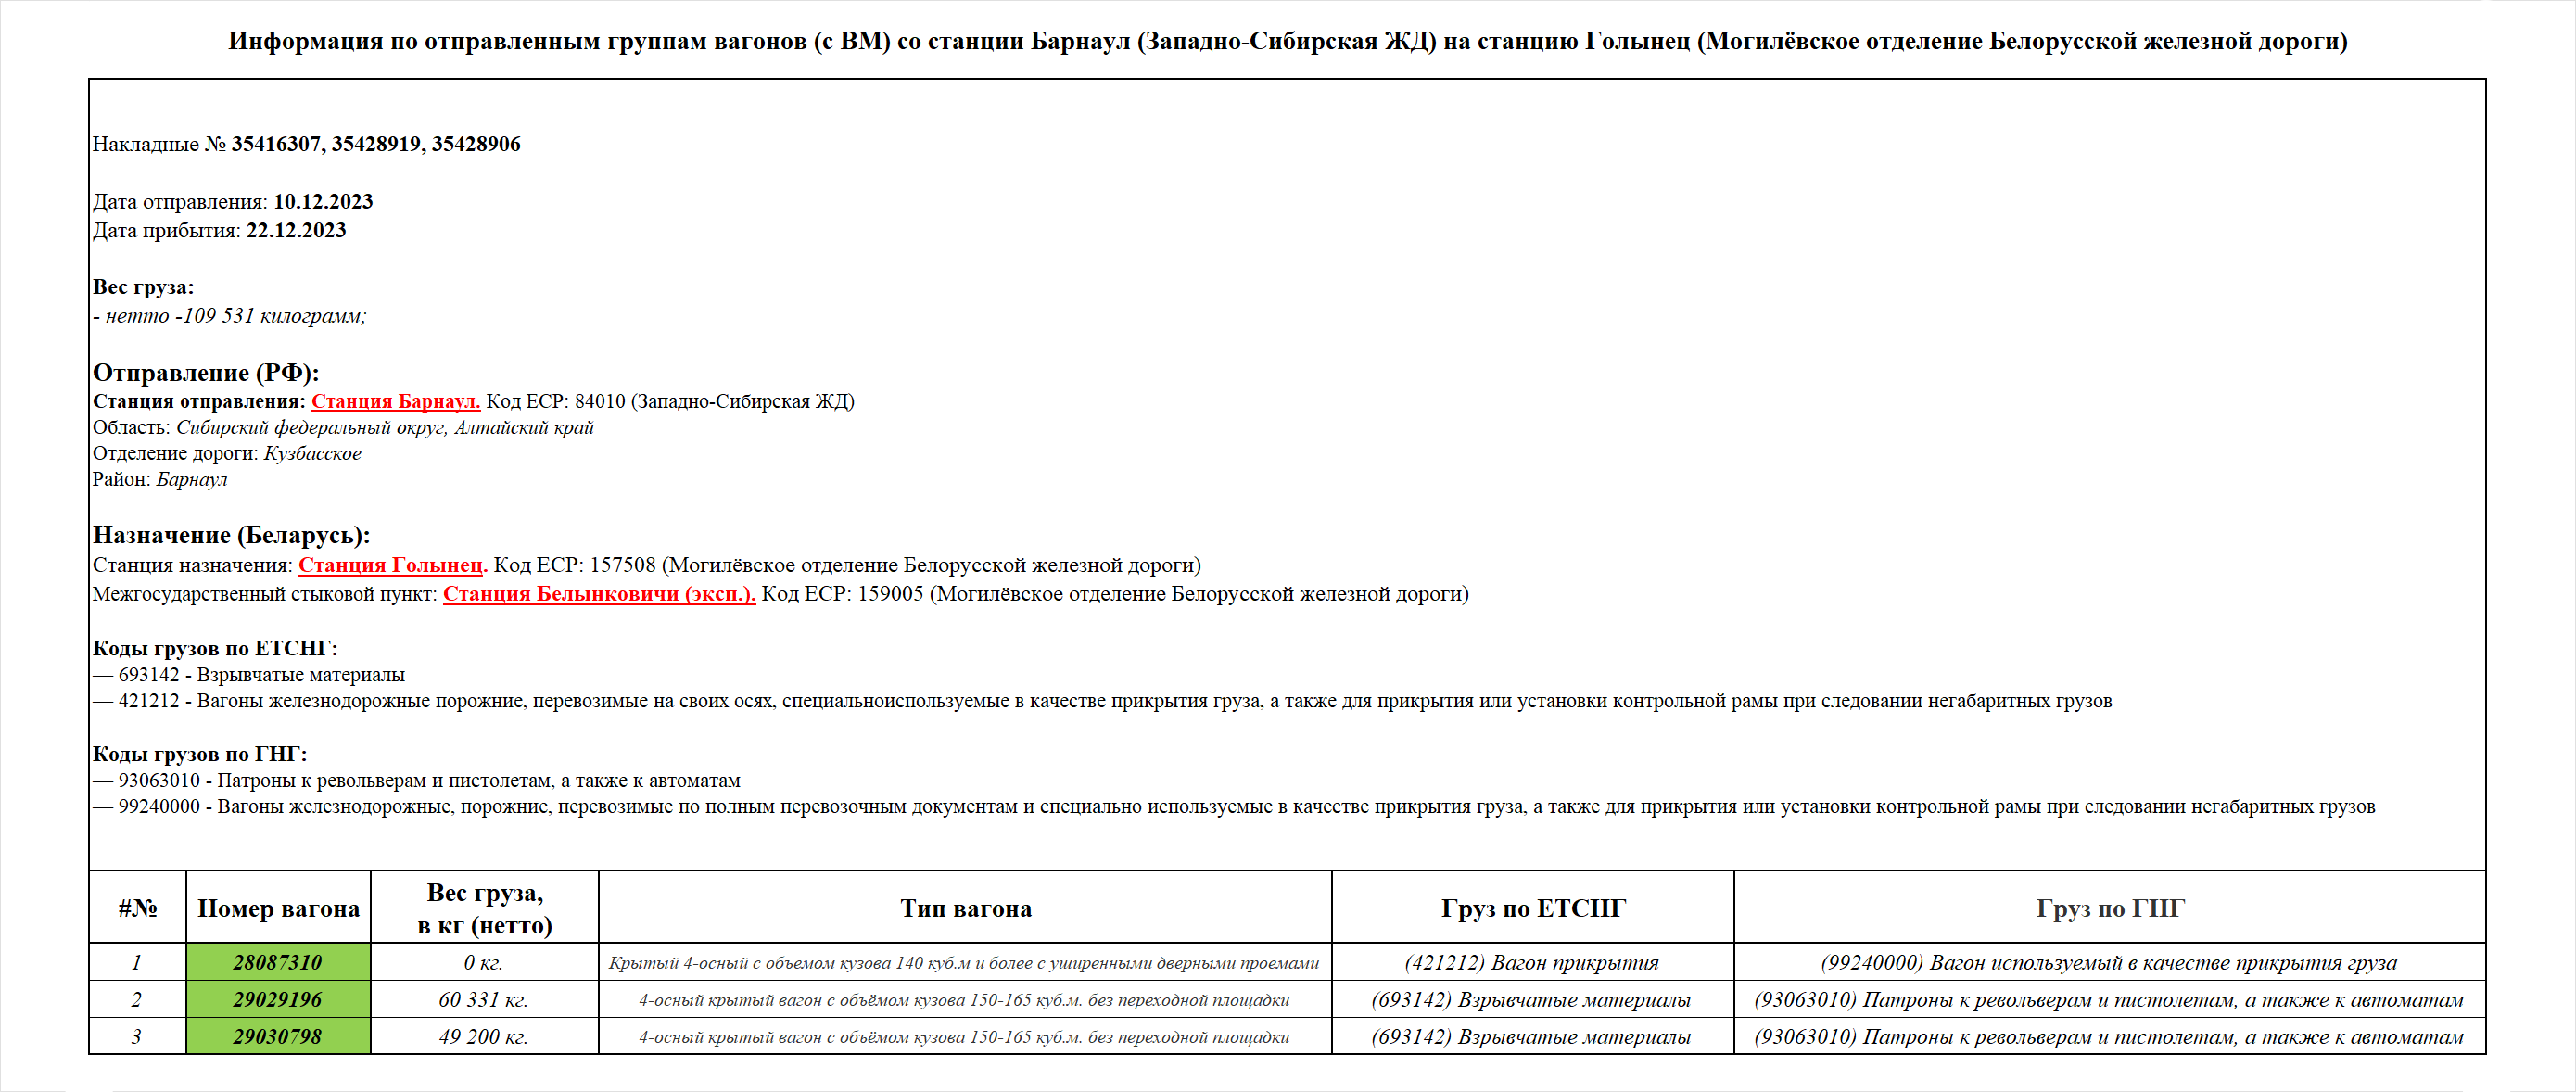
The cargo arrived on the Belarusian Railway via the Surazh–Belynkovichi interstate junction point on December 21, 2023, and reached the destination station, Golynets, on December 22, 2023.
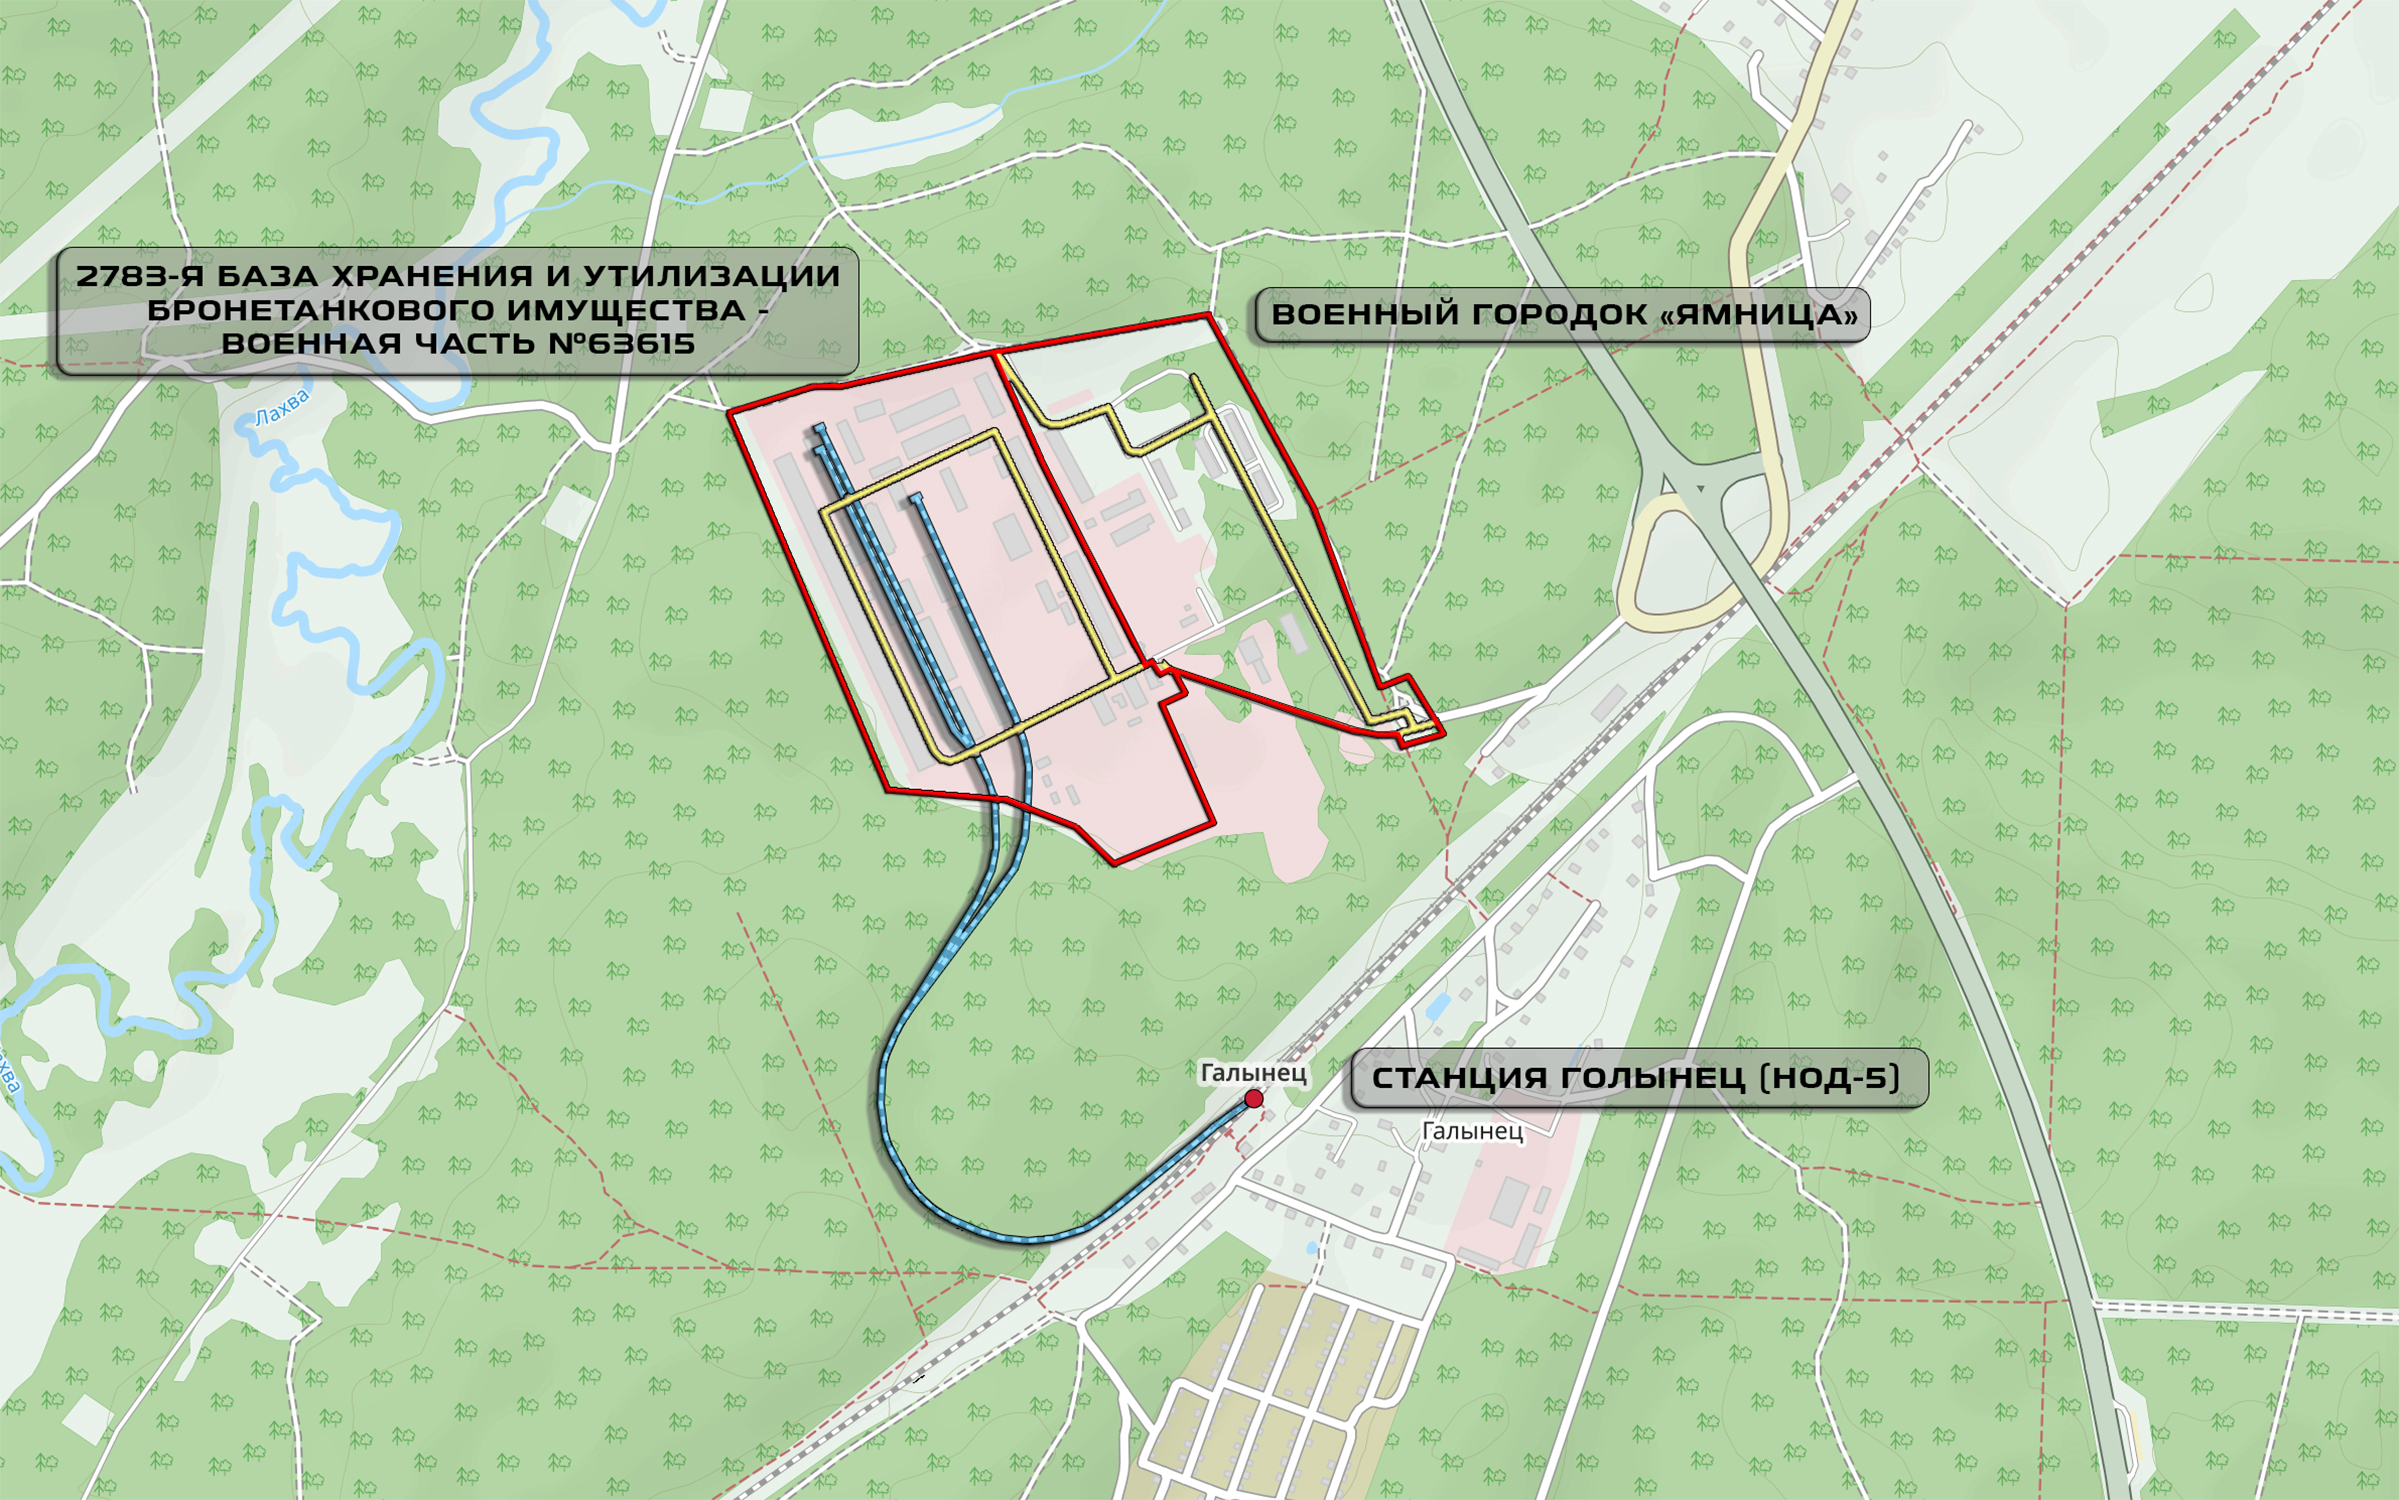
Located near Golynets station is the 2783rd Base for Storage and Disposal of Armored Equipment—military unit No. 63615, which has its own rail sidings, as well as the Yamnitsa military garrison.
The total mass of the delivered cargo is just under 110 tonnes (railcar 29030798 – 49,200 kg, railcar 29029196 – 60,331 kg). By rough estimates, this is equivalent to approximately 4–4.5 million rounds of ammunition for 7.62×39 automatic small arms or 8.5–9 million rounds of 5.45×39 caliber.
Considering the specialization of the destination (delivery) point for this ammunition, it can be assumed that its intended use is as ammunition for PKT machine guns (Kalashnikov tank machine gun, chambered for 7.62×54R). This type of weapon is mounted on the turrets of tanks and other armored combat vehicles (BMP, BMD, BTR-60PB/70/80/90, MT-LB, BMPT, BRDM-2, BRM-1K).
Barnaul station is located in the city of the same name, where a small arms ammunition manufacturing facility is situated—JSC “Barnaul Cartridge Plant”. The specified ammunition is listed in the product range of this plant.
As noted above, the organizer and freight forwarder of this shipment is JLLC “TRANSRAIL-BCh”. This company acted as the primary beneficiary in the transportation of tactical nuclear weapons (TNW) components* during their rail delivery to Belarus. Furthermore, this company has previously organized shipments of railcars with military cargo (military equipment and ammunition) that Russia’s military-industrial complex supplied to the Ministry of Defence.
As additional information becomes available regarding the implementation of military shipments from Russia to Belarus, as well as clarification of circumstances surrounding already completed but temporarily unpublished shipments of military cargo, this material will be updated.
* Tactical nuclear weapons (TNW) components refer to both the tactical nuclear weapons themselves (warheads) and their components and delivery systems (missiles, artillery shells, etc.), as well as associated equipment for ensuring safety and operation